Sunday 28 January 2018

Who discovered Neptune? Le Verrier, Galle, Adams... may be Galileo also

Neptune - the farthest planet
The planet Neptune was mathematically predicted before it was directly observed. With a prediction by Urbain Le Verrier, telescopic observations confirming the existence of a major planet were made on the night of September 23–24, 1846, at the Berlin Observatory, by astronomer Johann Gottfried Galle (assisted by Heinrich Louis d'Arrest), working from Le Verrier's calculations. It was a sensational moment of 19th-century science, and dramatic confirmation of Newtonian gravitational theory. In François Arago's apt phrase, Le Verrier had discovered a planet "with the point of his pen".
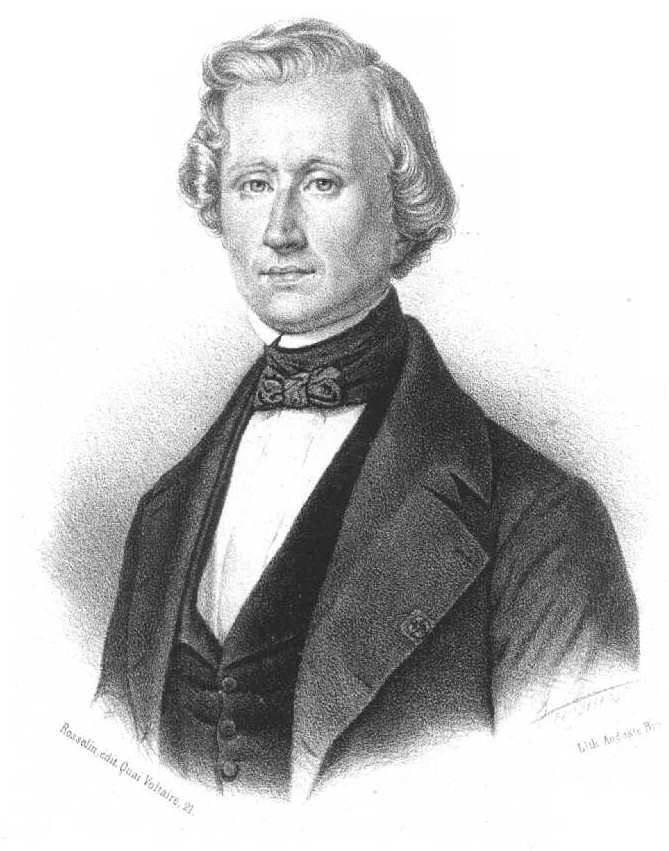
Urbain Le Verrier

Seen, but not discovered!

In retrospect, after it was discovered, it turned out it had been observed many times before but not recognized, and there were others who made various calculations about its location which did not lead to its observation.
By 1847, the planet Uranus had completed nearly one full orbit since its discovery by William Herschel in 1781, and astronomers had detected a series of irregularities in its path that could not be entirely explained by Newton's law of gravitation. These irregularities could, however, be resolved if the gravity of a farther, unknown planet were disturbing its path around the Sun.
In 1845, astronomers Urbain Le Verrier in Paris and John Couch Adams in Cambridge separately began calculations to determine the nature and position of such a planet. Le Verrier's success also led to a tense international dispute over priority, because shortly after the discovery George Airy, at the time British Astronomer Royal, announced that Adams had also predicted the discovery of the planet. Nevertheless, the Royal Society awarded Le Verrier the Copley medal in 1846 for his achievement, without mention of Adams.
The Copley Medal awarded to Mendeleev in 1905
The discovery of Neptune led to the discovery of its moon Triton by William Lassell just seventeen days later.
Triton (photographed by Voyager 2 in 1989)

Early Observations

Neptune is too dim to be visible to the naked eye. Therefore, the first observations of Neptune were only possible after the invention of the telescope. There is evidence that Neptune was seen and recorded by Galileo Galilei in 1613, Jérôme Lalande in 1795 and John Herschel in 1830, but none is known to have recognized it as a planet at the time. These pre-discovery observations were important in accurately determining the orbit of Neptune. Neptune would appear prominently even in early telescopes so other pre-discovery observation records are likely.
Galileo Galilei

Galileo's drawings show that he observed Neptune on December 28, 1612, and again on January 27, 1613; on both occasions, Galileo mistook Neptune for a fixed star when it appeared very close (in conjunction) to Jupiter in the night sky. Historically it was thought that he believed it to be a fixed blue star, and so he is not credited with its discovery. At the time of his first observation in December 1612, it was stationary in the sky because it had just turned retrograde that very day; because it was only beginning its yearly retrograde cycle, Neptune's motion was thought to be too slight, and its apparent size too small, to clearly appear to be a planet in Galileo's small telescope.
However, in July 2009 University of Melbourne physicist David Jamieson announced new evidence suggesting that Galileo was indeed aware that he had discovered something unusual about this "star". Galileo, in one of his notebooks, noted the movement of a background star (Neptune) on January 28 and a dot (in Neptune's position) drawn in a different ink suggests that he found it on an earlier sketch, drawn on the night of January 6, suggesting a systematic search among his earlier observations. However, so far there is neither clear evidence that he identified this moving object as a planet, nor that he published these observations of it. There is no evidence that he ever attempted to observe it again.

Sources -
  1. Wikipedia - Discovery of Neptune
  2. Space.com - New Theory: Galileo Discovered Neptune

Wednesday 24 January 2018

No double moon in 2018, or ever

This image sometimes circulates on Facebook, with the claim that Mars will appear as big and bright as a full moon. It’s a hoax. Don’t believe it.

Will Mars and the moon will appear the same size in 2018? No. What’s really amazing is the staying power of this hoax, which has its roots in a real 15-year cycle of Mars, that’s peaking – giving us an excellent year to observe Mars – in 2018.

We are likely to see it as an email – or on social media – in the form of a claim that Mars will appear as large as a full moon in Earth’s sky on a particular date. Sometimes there’s a suggestion that Mars and Earth’s moon will appear as a double moon. And that is just not true. It’s not true in 2018. It’s never been true. It never will be true.

Mars can never appear as large as a full moon as seen from Earth. As seen from Earth, in months when Mars does appear side by side with a full moon, Mars’ diameter appears, on average, about 1/140th the diameter of the full moon.

Mars is the planet orbiting the Sun one step outward from Earth’s orbit and is slightly smaller than Earth – but slightly larger than Earth’s moon. Mars is also much much farther away than Earth’s moon. It’s hard to comprehend what little specks the planets and moons are in contrast to the vastness of space.

Earth’s moon is about a light-second away. Light bouncing from the moon’s surface takes about a second to reach us here on Earth. Meanwhile, light from Mars takes much much longer to reach Earth – from several minutes to about 20 minutes – with the difference being the result of Earth’s and Mars’ motions around the sun. In other words, when Mars is on the same side of the sun as Earth, its distance from us is less than when it’s on the far side of the sun from us.

The moon is much closer than Mars, and that’s why we see the moon as a bright disk in our sky. Meanwhile – to the eye – Mars appears as a reddish star-like point.

So how did this rumor of Mars-as-big-and-bright-as-the-moon get started? It started in 2003. On 27th August 2003, Earth and Mars came very slightly closer than they’d been in nearly 60,000 years. Center-to-center, Earth and Mars were less than 35 million miles apart – just over three light-minutes apart. The last people to come so close to Mars were Neanderthals. Astronomy writers had a field day that year, talking about Mars at its closest.

Was it a spectacular sight? Yes! Mars looked like a dot of flame in the night sky. Was Mars as big and bright as the moon, even at its closest in 2003? Never.

The 2003 event was part of a 15-year cycle for Mars. Think of Earth and Mars in orbit around the sun again. Neither Earth nor Mars has a circular orbit. Both worlds have elliptical orbits. So both Earth and Mars have a closest point to the sun. When Earth passes between the sun and Mars (opposition) around the time Mars is closest to the sun (perihelion) – Earth and Mars come closest.

Diagram by Roy L. Bishop. Copyright Royal Astronomical Society of Canada. This diagram explains why, in 2016, Mars was closer than it had been in 10 years. In 2018, it’ll be even closer … but never moon-sized in Earth’s sky.
If we look closely at this diagram, we can see that Earth and Mars will have a particularly close opposition in mid-2018. Mars will be closer than it’s been since 2003!

It’ll be bright and very reddish but only like a dot of flame.

Source - EarthSky.org

How massive can neutron stars be?

In 2016, when the twin LIGO detectors made their first historic observation of gravitational waves, astronomers heralded the news both as a confirmation of Einstein’s general relativity and also because, as they love to say, the detection opened a new window on the cosmos.

On January 16, 2018, astrophysicists at Goethe University in Frankfurt, Germany described how they used observations of gravitational waves to answer a question that’s plagued scientists since the 1960s, when they first discovered neutron stars, or stars composed predominantly of closely packed neutrons. By definition, a neutron star has a very small radius and very high density (a teaspoon of neutron star material would weigh about 10 million tons). A typical neutron star mass is about 1.4 suns.

Notice all the abouts in those last couple of sentences? Now, for the first time, astrophysicists have succeeded in putting more precision into those numbers, by calculating a strict upper limit for the maximum mass of neutron stars. They say that, with an accuracy of a few percent, the maximum mass of non-rotating neutron stars cannot exceed 2.16 solar masses.

What happens to a neutron star that does exceed its mass limit? In that case, the neutron star collapses into an even more compressed and vastly more exotic object known as a black hole.

Source - EarthSky.org

Friday 19 January 2018

Sirius - future South Pole Star


Tonight, as darkness falls, use Orion’s Belt to star-hop to Sirius, a future South Pole Star. Sirius is in the constellation Canis Major, the Greater Dog. It’s sometimes called the Dog Star. It’s easy to see, since it’s the brightest star in the night sky. We’ll always know you’ve found Sirius if you notice that the three stars in Orion’s Belt point to it.
Here in the Northern Hemisphere, we’re lucky to have a moderately bright star, Polaris, to pinpoint our north celestial pole. If we know Polaris, and get lost, this star can help us be found again.
Unlike the Northern Hemisphere, the Southern Hemisphere doesn’t have a bright pole star. There just doesn’t happen to be a bright star, not even a moderately bright star like Polaris, to mark the south celestial pole, the point in the sky directly over the Earth’s South Pole.
But the stars are not truly fixed. Because stars actually change positions relative to one another over the long course of time, brilliant Sirius will take its turn as the South Pole Star in the year 66270. In fact, Sirius will come to within 1.6o of the south celestial pole in 66270. One precessional cycle later, in the year 93830, Sirius will miss aligning with the south celestial pole by only 2.3o.
The star Polaris comes closer to the north celestial pole, by the way. It’ll be within 0.5o of the north celestial pole in the year 2100.
Before Sirius becomes a pole star, another star – a moderately bright star, not very different in brightness from Polaris – will take its place more or less over the south celestial pole. That’ll happen about 7,000 years from now. Because of precession, the star Delta Velorum in the constellation Vela the Sail will come to within 0.2o of the south celestial pole in the year 9250. That’s closer than Polaris or Sirius!
Source - EarthSky.org

Thursday 4 January 2018

What is a blue moon?


A blue moon is an additional full moon that appears in a subdivision of a year: either a second full moon in a month of the common calendar or the third of four full moons in a season.

The phrase has nothing to do with the actual color of the moon, although a literal "blue moon" (the moon appearing with a tinge of blue) may occur in certain atmospheric conditions: e.g., if volcanic eruptions or fires leave particles in the atmosphere of just the right size to preferentially scatter red light.

On January 31, the moon will be full for the second time in a month, a rare occasion—it happens once every two and a half years.

Can our brain have a traffic jam?

The brain is an incredible processor, but is it possible to overload it?

In the average, healthy individual, the brain is an incredible piece of machinery capable of keeping the heart pumping, performing complex mental tasks and even allowing you to walk and chew gum, all at the same time. To a large degree, the brain is able to avoid traffic jams and keep all of these things happening at once with ease. To avoid interference between different parts of the brain, various regions operate on different frequencies.

For example, our hippocampus sends signals at around 5 hertz, while brain areas related to movement operate at 32 to 45 hertz. Think of it like the layers on an exit ramp. Signals sent at one frequency might travel on a different layer than those at another frequency, so these signals can avoid collision. These frequency differences allow different parts of the brain to operate all at once without interrupting one another or misinterpreting signals meant for other brain areas.

Despite this high level of sophistication, it's not a perfect system. After all, there has to be one mechanism responsible for initiating all those signals before they can travel through the brain. Some scientists refer to this mechanism as a "router" of sorts, which takes in information and sends signals throughout the brain. These signals don't bump into others thanks to frequency differences, but the router itself can suffer from overload if it receives signals too close together.

Right after a signal is received, the brain experiences a refractory period where it needs to reset itself in order to receive and process the next signal. If information is received during this refractory period, it can be missed or misprocessed because the brain's router is otherwise occupied.

The brain can also experience miniature traffic jams thanks to blockages along the paths that neurons take as they carry signals through the brain. Researchers discovered that fruit flies experience small, benign blockages on these neural pathways, which block brain signals, causing a traffic jam that can last for up to 30 seconds. Most of the time, these road blocks go away on their own, but some can remain permanently, interfering with communication between different parts of the brain. Further research on these traffic jams may help scientists treat serious neurological conditions, such as Alzheimer's.

Source - HowStuffWorks.com - Can your brain have a traffic jam? published by Bambi Turner on 12 March 2015

How much does light weigh?

Does light weigh anything? Well, yes and no.


If there were a simple answer to how much light weighs, we'd all know it. There would probably be some sort of elementary school rhyme to help us remember the exact figure! Instead, we are forced to wade through complicated half-answers that go something like, "Um, it kind of weighs a little, but not like how regular things weigh."

Photons are the smallest measure of light, and no, they don't have mass. So that's easy, right? Light is composed of photons, which have no mass, so therefore light has no mass and can't weigh anything.

Not so fast. Because photons have energy - and, as Einstein taught us, energy is equal to the mass of a body, multiplied by the speed of light squared. How can photons have energy if they have no mass?

Actually, what Einstein was proving is that energy and mass could be the same thing - all energy has some form of mass. Light may not have rest (or invariant) mass - the weight that describes the heft of an object. But because of Einstein's theory (and the fact that light behaves like it has mass, in that it's subject to gravity), we can say that mass and energy exist together. In that case, we'd call it relativistic mass - mass when an object is in motion, as opposed to at rest.

So our answer is a grab bag of yeses and nos. Does light have a mass that can be weighed on the bathroom scale? Most certainly not. But it is a source of gravitational fields, so we could say that a box of light weighs more than a box without light - as long as you're comfortable understanding that the "weight" you're measuring is a form of energy and not, say, pounds or kilograms.

Source - HowStuffWorks.com - How much does light weigh? by Kate Kershner published on 22 September 2014

Tuesday 2 January 2018

How does Google Maps predict traffic?


The green, yellow and red routes that Google Maps uses to indicate clear, slow-moving, or heavily congested traffic are a great help when you're trying to determine the fastest way to your destination, but how does Google know the traffic conditions between where you are and where you're trying to go?


Google Maps bases its traffic views and faster-route recommendations on two different kinds of information -
  1. Historical data about the average time it takes to travel a particular section of road at specific times on specific days
  2. Real-time data sent by sensors and smartphones that report how fast cars are moving right then

Early versions of Google Maps relied only on data from traffic sensors, most of which were installed by government transportation agencies or private companies that specialize in compiling traffic data. Using radar, active infrared or laser radar technology, the sensors are able to detect the size and speed of passing vehicles and then wirelessly transmit that information to a server. Data from these sensors can be used to provide real-time traffic updates, and, once collected, the information becomes part of the pool of historical data used to predict traffic volume on future dates. However, sensor data was largely limited to highways and primary roads (that too only in the Western world) because the sensors were typically installed only on the most heavily traveled or traffic-prone routes.

Beginning in 2009, Google turned to crowd-sourcing to improve the accuracy of its traffic predictions. When Android phone users turn on their Google Maps app with GPS location enabled, the phone sends back bits of data, anonymously, to Google that let the company know how fast their cars are moving. Google Maps continuously combines the data coming in from all the cars on the road and sends it back by way of those colored lines on the traffic layers.

As more and more drivers use the app, the traffic predictions become more reliable because Google Maps can look at the average speed of cars traveling along the same route (without misinterpreting someone's morning coffee stop as a traffic jam). If Google Maps doesn't have enough data to estimate the traffic flow for a particular section of road, that section will appear in gray on the traffic layer.

Google added a human element to its traffic calculations with its acquisition of Waze. Drivers use the Waze app to report traffic incidents including accidents, disabled vehicles, slowdowns and even speed traps. These real-time reports appear as individual points on Google Maps, with small icons representing things like construction signs, crashed cars or speed cameras.


Source - HowStuffWorks.com - How does Google Maps predict traffic? by Beth Brindle published on 31 October 2014